Your website conversion rate is the share of sessions that end in a desired action: conversions divided by sessions, times 100.
The figure only means something once you have fixed three things: what counts as a conversion, whether you divide by sessions or by users, and which period you measure. Change any one of them and the same site can show a different rate. That is also why the question of what a good rate is has no single answer. Below are the formula, how Google Analytics 4 (GA4) handles it, five public benchmark sources, what a redesign can and cannot move, and how to read an agency's lift claim before you sign.
If you are about to hire, write down your baseline before the first sales call, then use it to compare proposals from web design teams vetted on one public scorecard. If you sell online, bring the same baseline when you talk to the store-focused web design teams we rank.
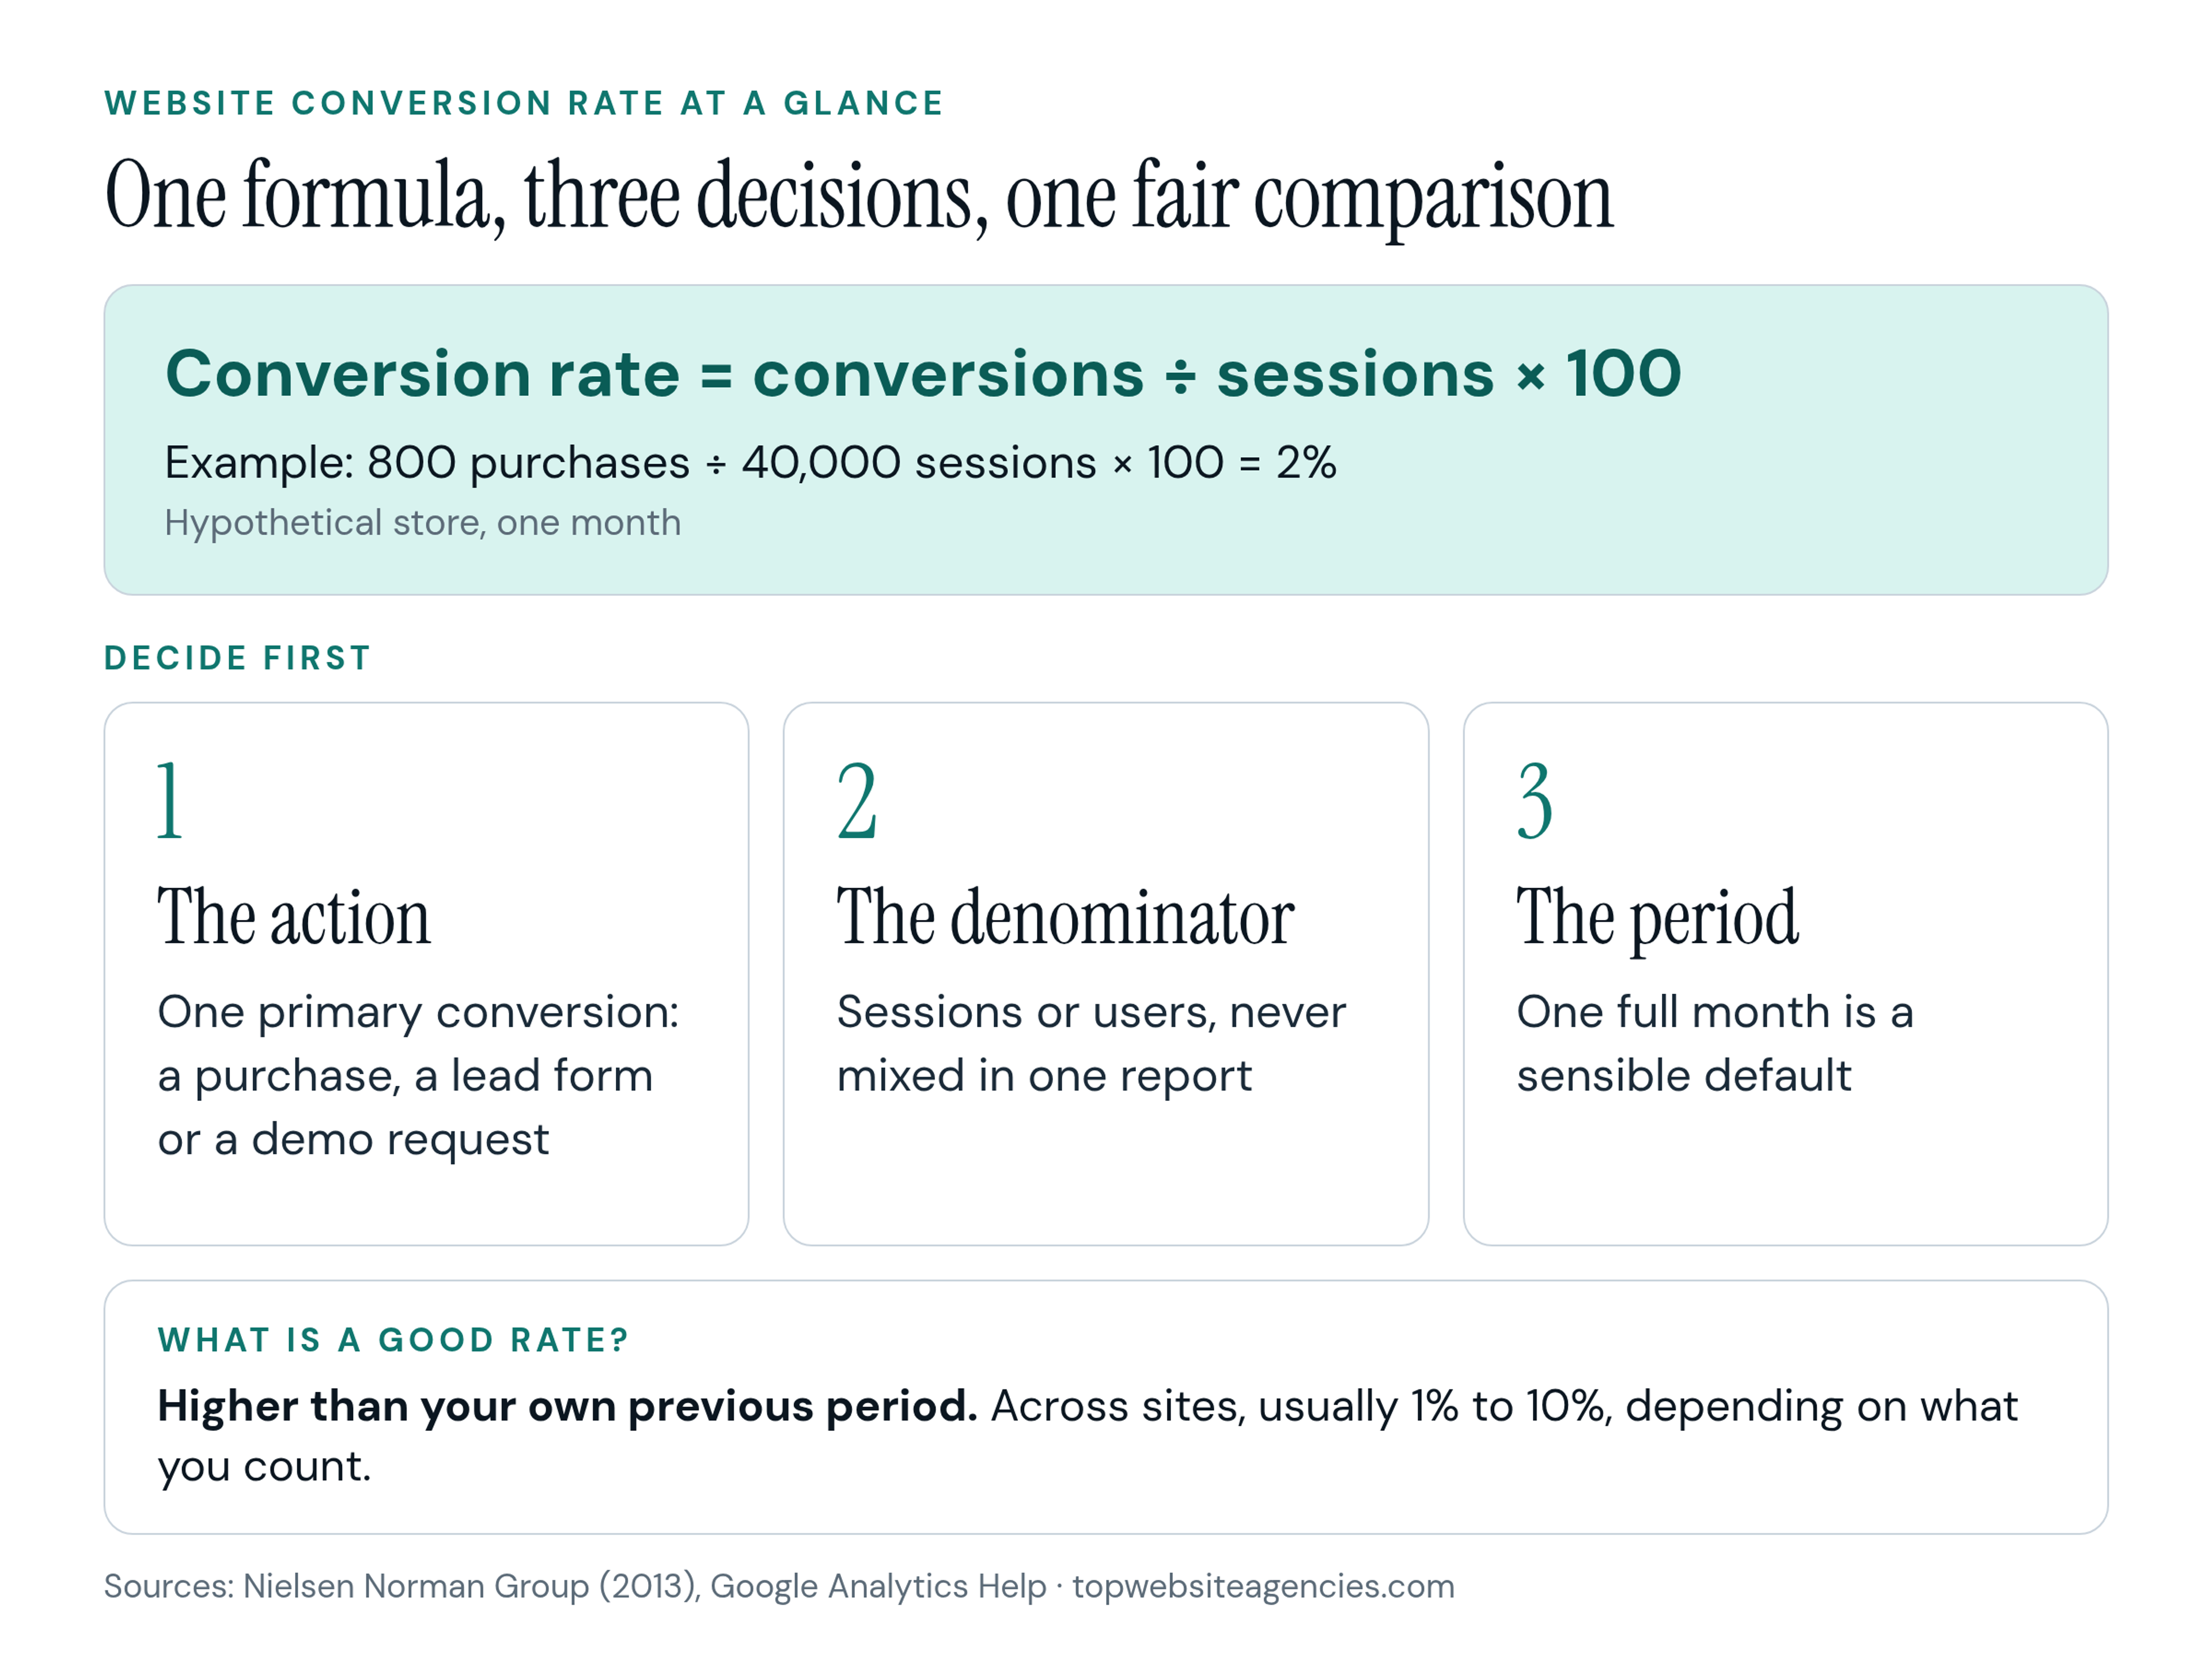
How to Calculate Website Conversion Rate
The formula is conversions divided by sessions (or users), multiplied by 100. According to Nielsen Norman Group's 2013 article on conversion rates (NN/g), it is the "percentage of users who take a desired action", and the article gives a simple example: an ecommerce site visited by 100,000 people in April, 2,000 of whom bought something, has a 2% rate.
Make three choices before you calculate anything:
- The action. Pick one primary conversion, such as a purchase, a lead form or a demo request. Counting every click inflates the rate and tells you little.
- Sessions or users. GA4 supports both. According to Google Analytics Help's list of dimensions and metrics, the "Session key event rate" is the number of sessions in which a key event happened divided by the total number of sessions, and the "User key event rate" is the users who performed a key event divided by total users. Pick one and keep it in every report.
- The period. NN/g's 2013 article suggests a month as the default period. A single week can be skewed by a promotion or a press mention.
A hypothetical example: a store with 40,000 sessions in a month and 800 purchases has a session-based rate of 800 ÷ 40,000 × 100 = 2%. If, in the same hypothetical example, those sessions came from 32,000 users and 800 of them bought, the user-based rate is 2.5%. Both are correct, but they answer different questions, so never compare one against the other.
Also separate macro conversions, such as a completed purchase, from micro conversions, such as adding an item to a cart or subscribing to a newsletter. Micro conversions are useful diagnostics. I'd report them next to the primary rate rather than blending them into it.
Next step: pull the last full month from GA4 and write down the rate, the conversion definition and whether it is session-based or user-based.
What Counts as a Conversion
A conversion is whatever action your business needs from a visit, such as a purchase, a lead form, a demo request, a sign-up or a tracked call. In GA4 these are called key events, and Google's Analytics Help page on key events allows up to 30 per standard property and up to 50 in 360 properties.
That page also says the purchase event is a key event by default. It says marking a key event does not change historic data, and that it can take up to 24 hours to show in standard reports. In practice, mark your key events before the redesign starts. Otherwise you will have no clean before-and-after comparison for them.
If you run a SaaS site, our conversion basics for SaaS marketing sites cover that case. The point here is only that the definition has to be written down, whatever the business model.
Agree these four items in writing with your agency before kickoff:
- Primary conversion: the one action the redesign is judged on.
- Secondary actions: the micro conversions you track as diagnostics.
- Denominator: sessions or users, matching what your analytics reports.
- Reporting period: the baseline month and the comparison month.
Next step: send the written definition to every agency on your shortlist and ask them to confirm they will report against it.
What Is a Good Website Conversion Rate?
There is no single good number. Nielsen Norman Group says in its 2013 article that a good conversion rate for your site is one that is "higher than what you had before", and adds: "Depending on what you're counting, a good conversion rate is usually in the 1%–10% range."
I compared five public benchmark sources on Nov 20, 2026. Beyond NN/g's range, the other four measure different things, so here is what each one counts:
- Statista (e-commerce visits): Statista's online shopper conversion rate statistics reported that during the third quarter of 2026, the global average conversion rate for visits to e-commerce websites worldwide was 1.6 percent.
- Ruler Analytics (forms and calls): In its "Conversion Rate Benchmarks for 2027" (dated 13 November 2026), Ruler Analytics reported an average of 5.13% across the 5 million+ conversions it tracked in 13 industries. Ruler's industry figures run from travel at 1.9% to legal and automotive at 7.9%, with retail & eCommerce at 2.4% and software at 7.6%.
- Unbounce (landing pages): Unbounce's 2024 Conversion Benchmark Report is based on 41K+ landing pages, 464M+ unique visitors and 57M+ conversions that Unbounce analyzed in the past year. It reports a median conversion rate of 6.6% across all industries, nine industry figures from 3.8% to 12.3%, and an average of 19.3% for email. It looked at conversion events, not value per conversion.
- Contentsquare (session data): Contentsquare's 2026 Digital Experience Benchmarks (published March 9, 2026) draw on 99 billion web and app sessions across 6K+ sites. In that 2026 data, returning visitors convert at 2.9% versus 1.7% for new visitors, and paid search, at 2.8%, is the highest among paid channels.
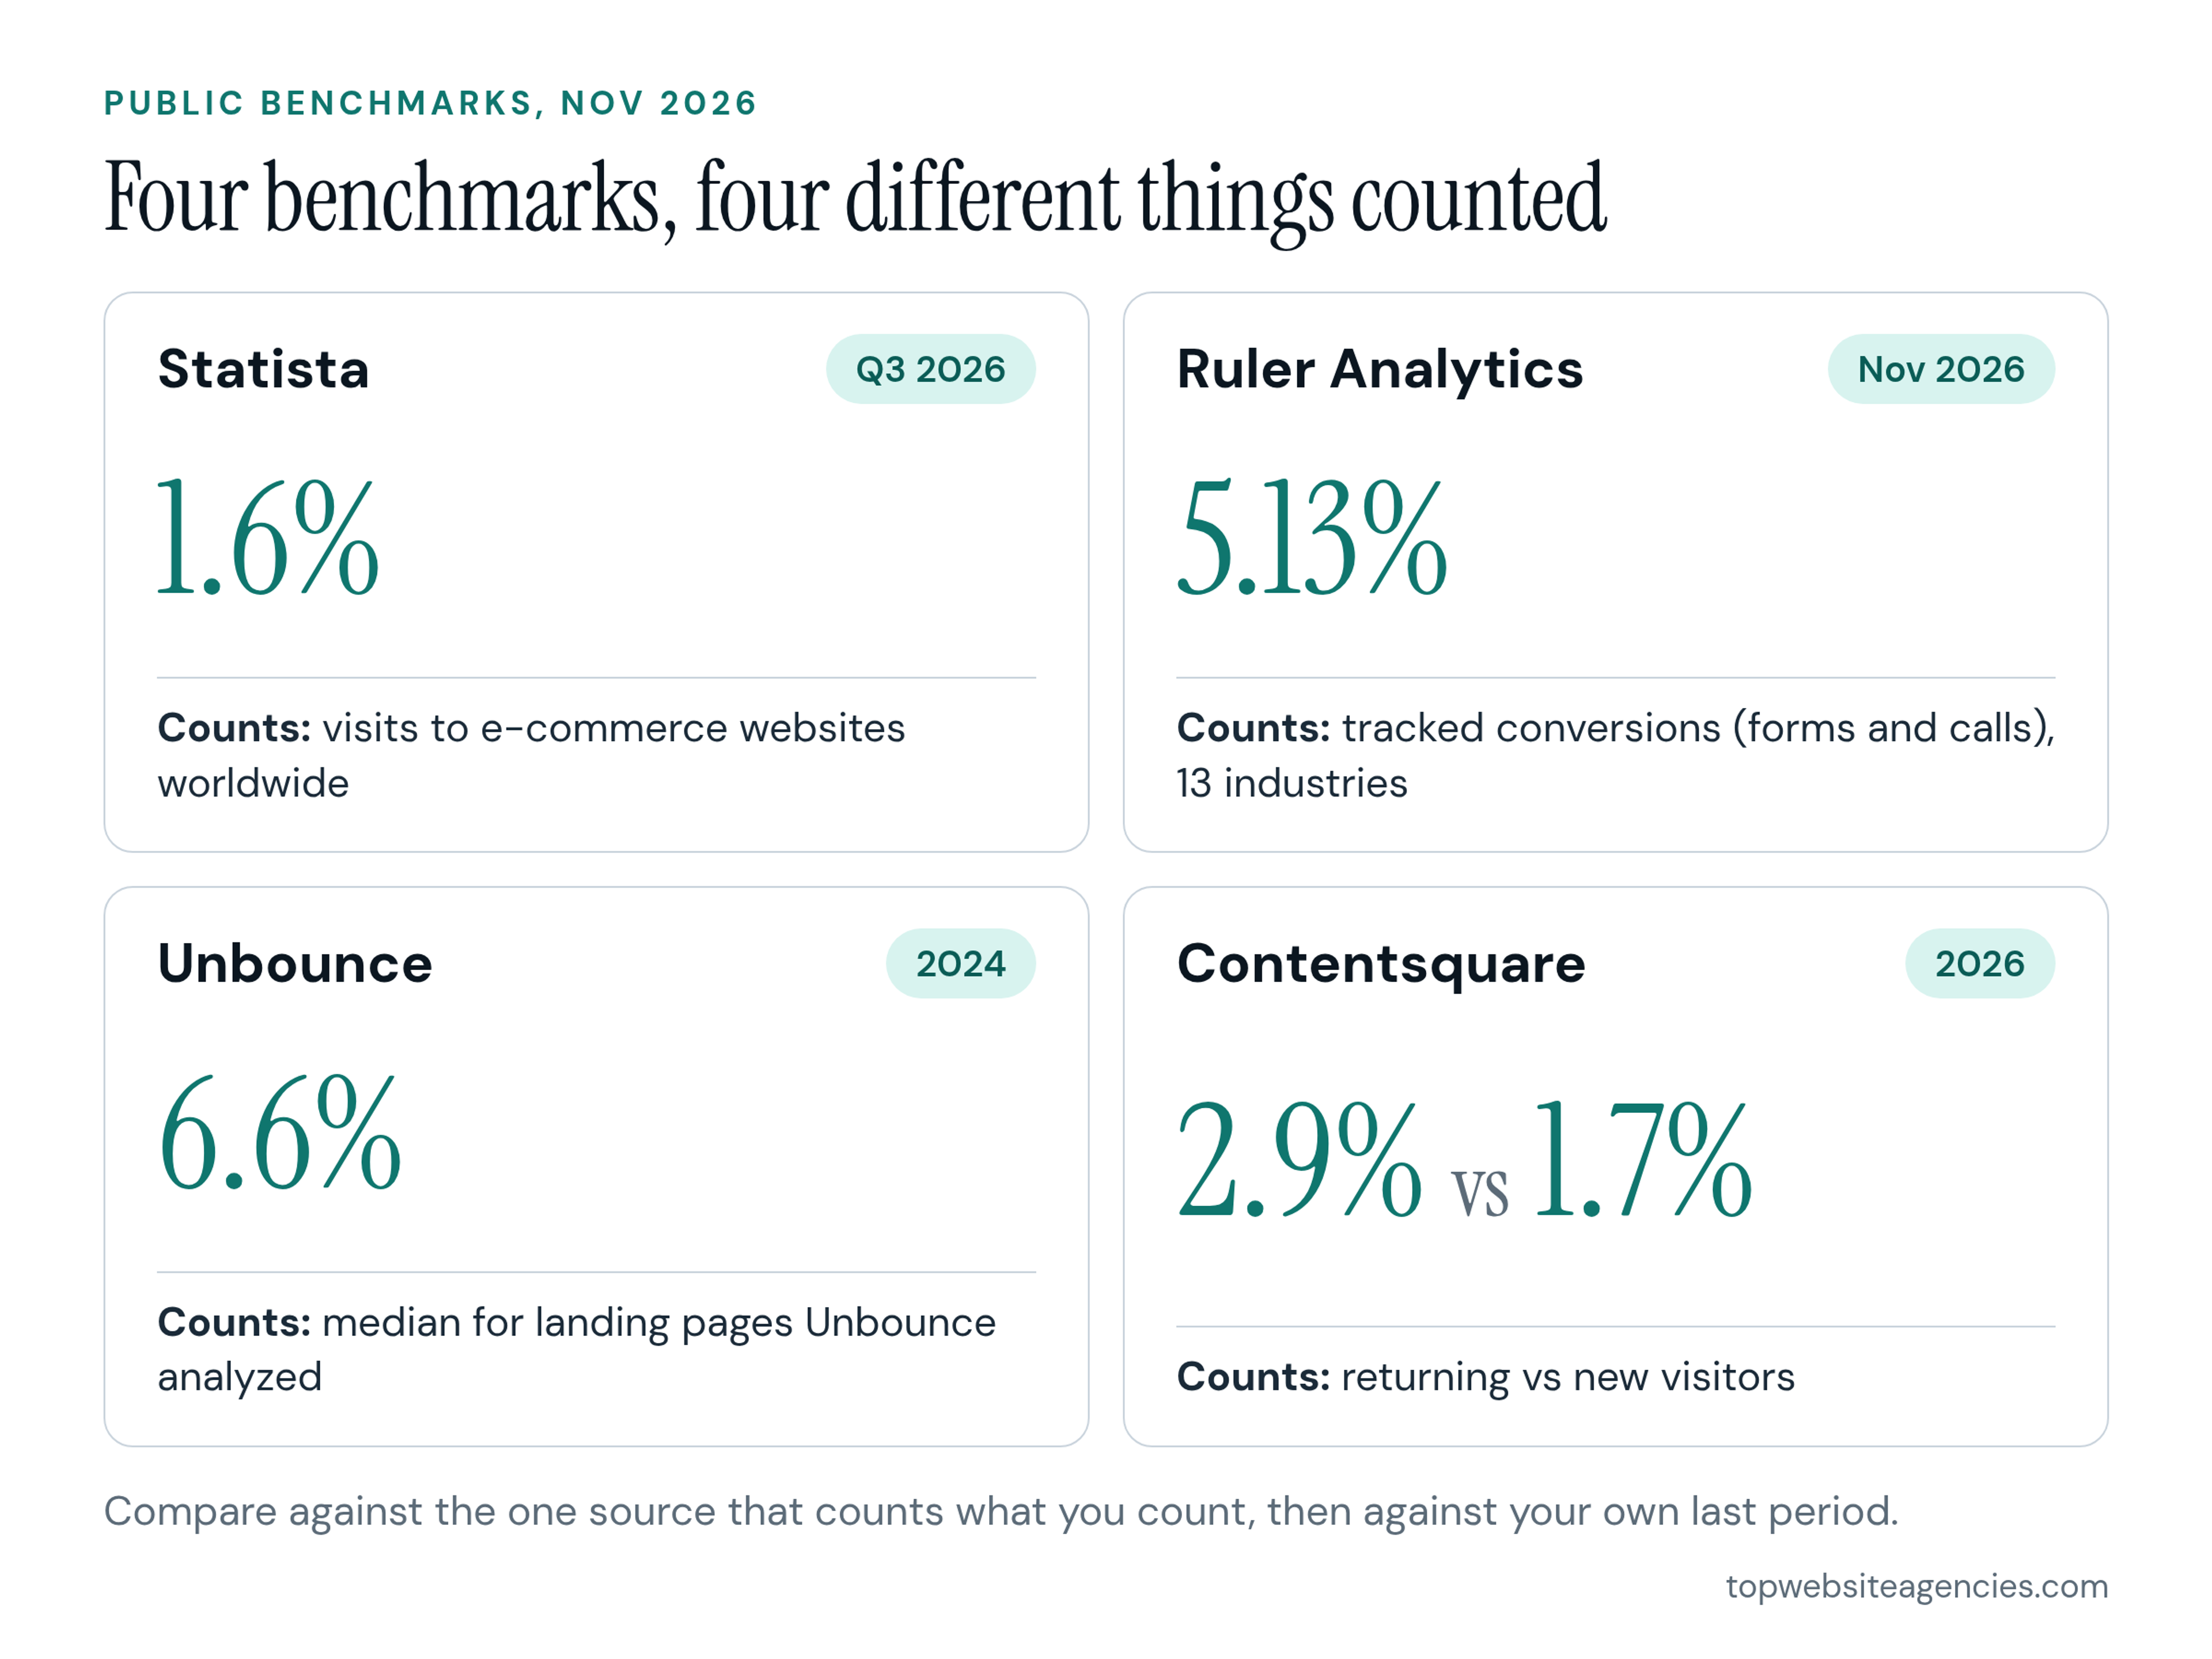
These numbers differ because they count different things: store visits, form fills and calls, conversions on the landing pages one vendor analyzed, and sessions across thousands of sites. A 1.6% store figure (Statista, Q3 2026) and a 6.6% landing-page median (Unbounce, 2024) are not in conflict, and averaging them would be meaningless. Compare yourself first to your own previous period, then to the one source whose definition matches your conversion and traffic.
Next step: choose the single benchmark that matches your conversion type and use it only as context for your own trend.
What Moves Conversion Rate (and What Doesn't)
Design is one input among several. Nielsen Norman Group's 2013 article lists brand, price, sales complexity and level of commitment as factors outside UX that affect the rate.
Traffic mix matters too. In the same article, NN/g describes an April Fools article that brought four times the usual traffic that day, and the conversion rate fell to almost a quarter of its normal level. A falling rate can mean different visitors, not a worse site, so read your rate next to your traffic sources. A fair agency proposal says which of price, brand and product mix it assumes stay fixed.
Levers a redesign can actually pull:
- Offer clarity on the first screen. In my view, a visitor should know what you sell and what to do next without scrolling.
- Page speed. A web.dev case study from March 17, 2021 describes a Vodafone A/B test on a landing page where the only difference was Web Vitals optimization: "a 31% improvement in LCP led to 8% more sales" (LCP is Largest Contentful Paint), plus a 15% better lead to visit rate and an 11% better cart to visit rate. That is one test at one company in 2021, so treat it as an example of what is possible, not a result you can promise for your site.
- Forms. NN/g's form example (Nielsen Norman Group, 2013) shows what one point is worth: if 100,000 people a year reach a form, lifting its conversion rate from 10% to 11% means 1,000 more completions. Fewer fields is a common thing to test.
- Trust and proof near the action. Reviews, guarantees and contact details belong next to the button or form, not three screens away.
- The path to buy or contact. Fewer steps and clicks between interest and action.
- Mobile experience. Contentsquare's 2026 benchmark data has mobile at 69.9% of traffic, while its desktop conversion rate is 74% higher than mobile. A gap that size in Contentsquare's data is worth raising with any agency you talk to.
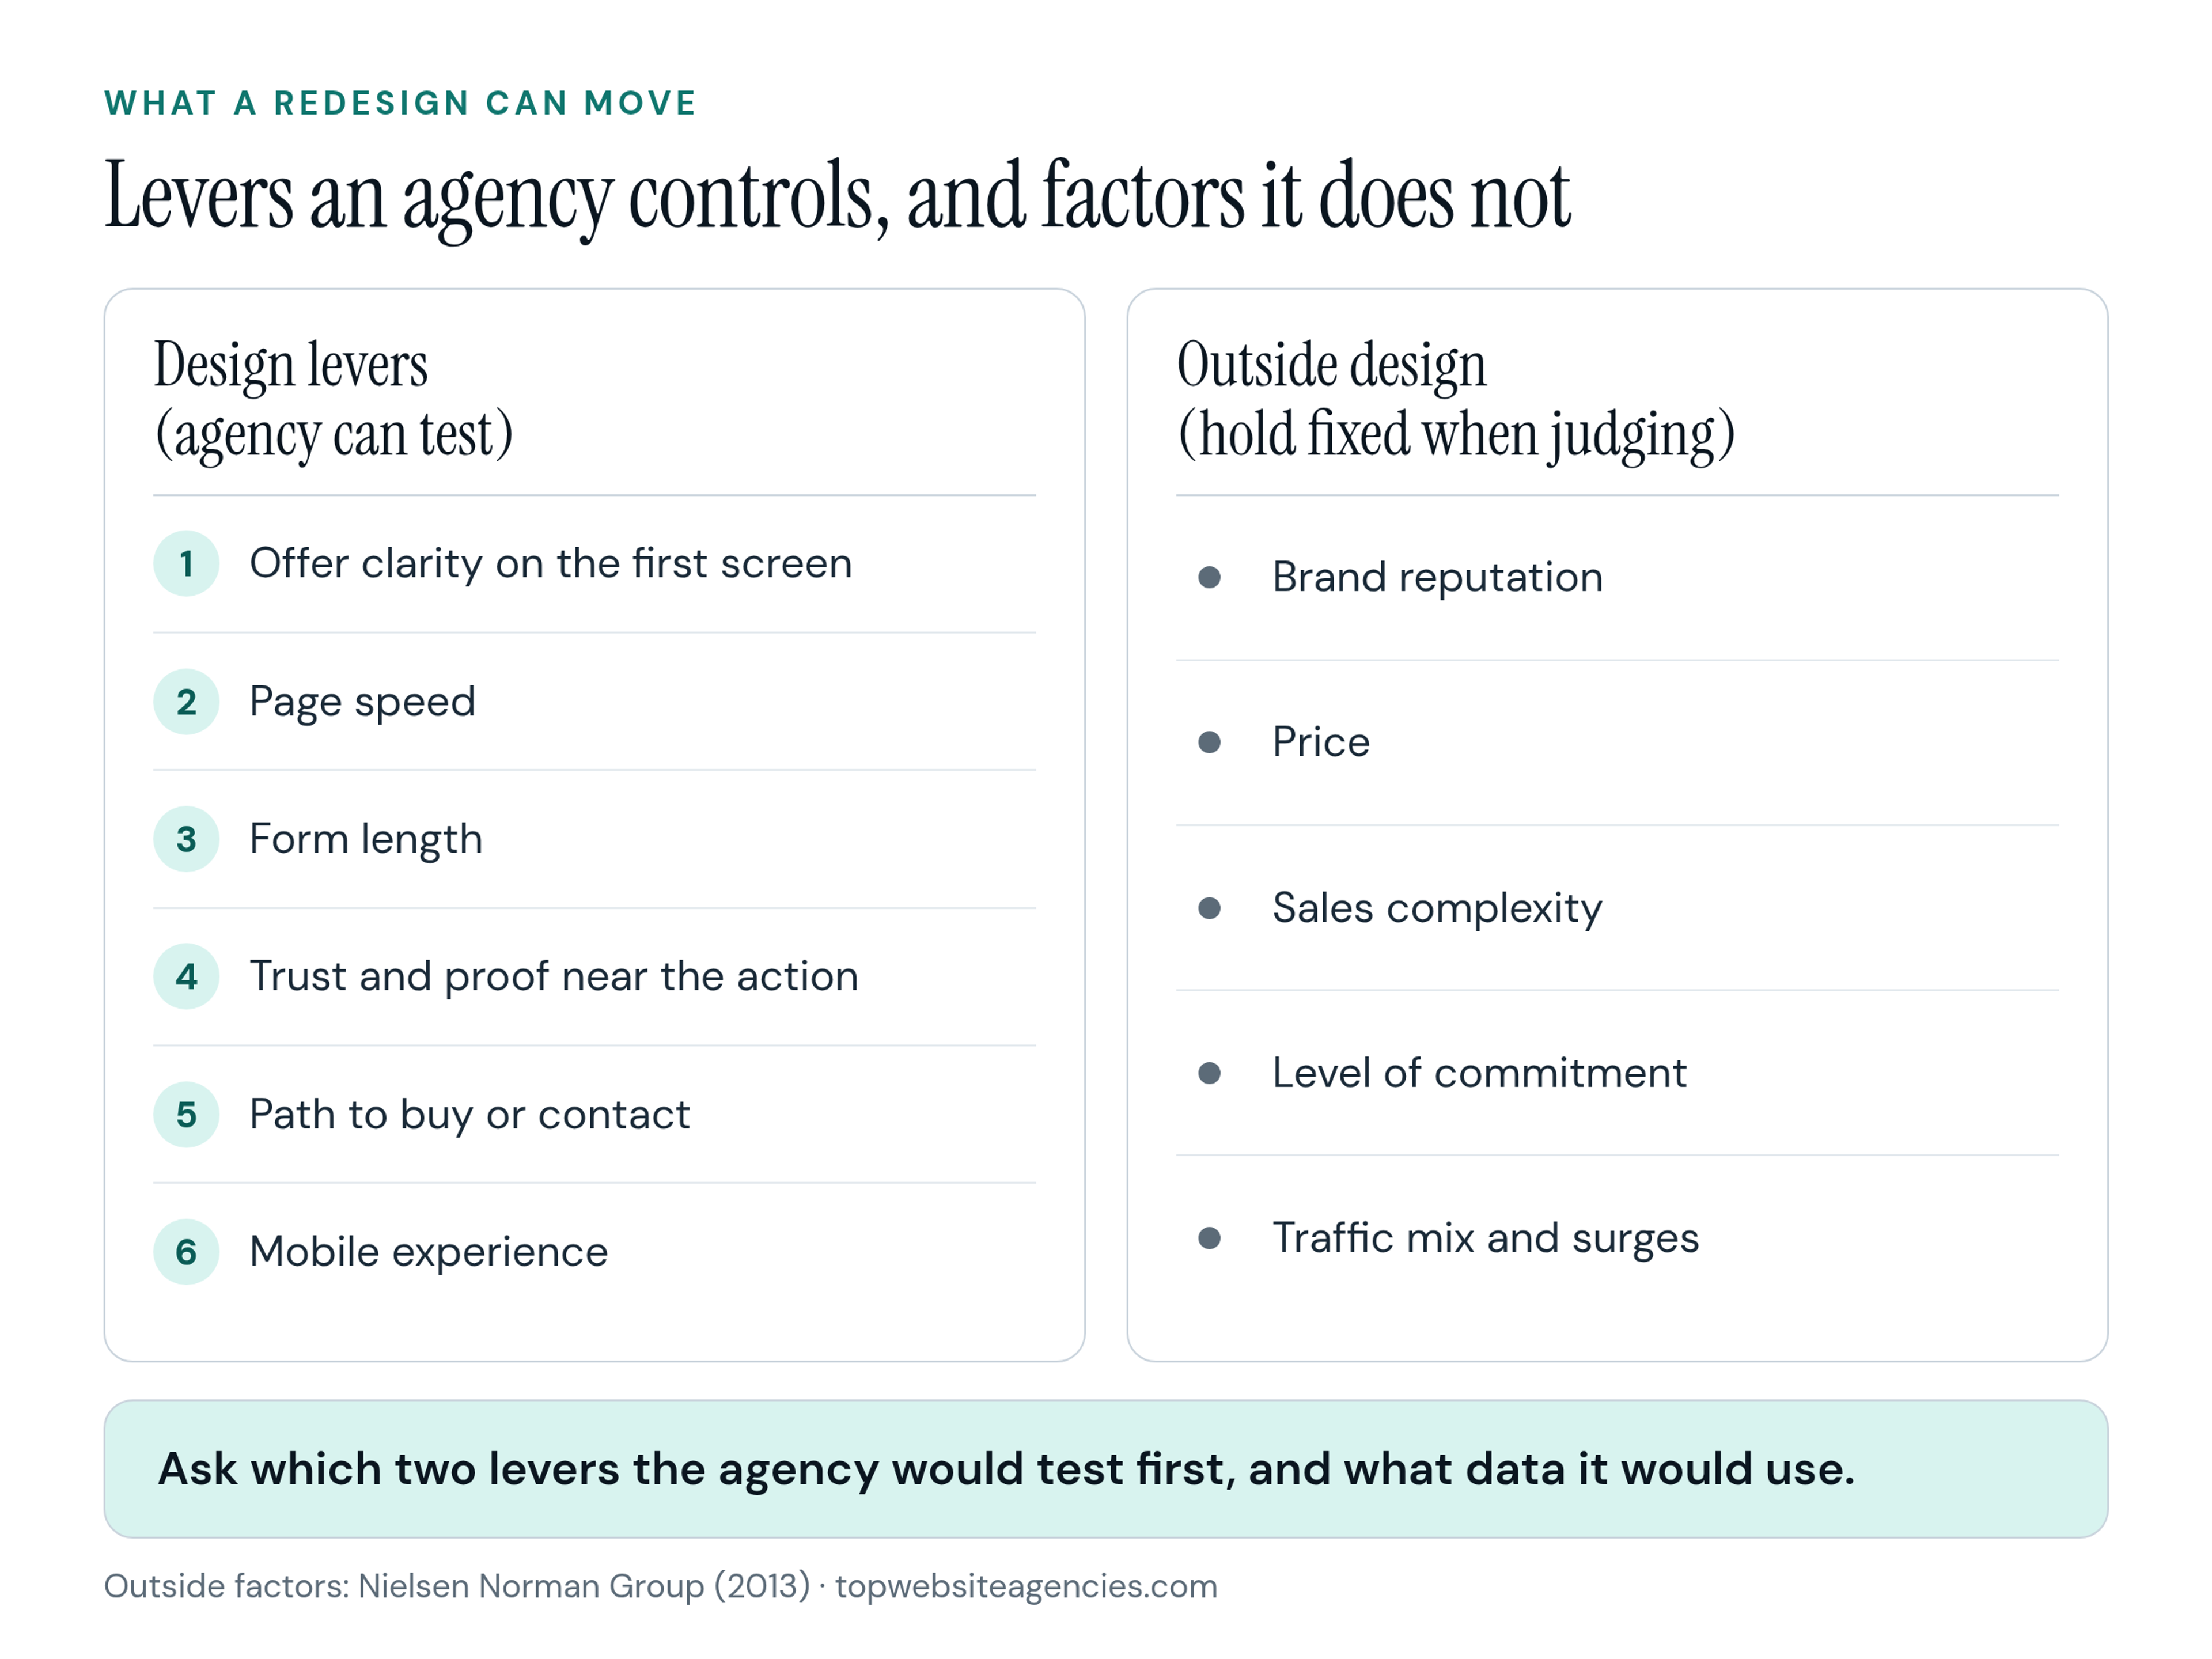
Next step: ask each agency which one or two of these levers it would test first on your site, and what data it would use to decide.
How to Judge an Agency's Conversion Rate Claims
Judge a lift claim by the traffic behind it. When I entered a 2% baseline and a 20% relative lift into Evan Miller's A/B testing sample size calculator, it asked for 19,784 visitors per variation at 80% power and 5% significance.
A pitch may promise a percentage lift, so on Nov 20, 2026, I ran four cases through that calculator to see how much traffic such a claim needs. It asked for 19,784 visitors per variation for a 2% baseline and a 20% relative lift (2.0% to 2.4%), 78,039 for a 2% baseline and a 10% lift, 39,986 for a 1% baseline and a 20% lift, and 7,663 for a 5% baseline and a 20% lift (Evan Miller sample size calculator, 80% power, 5% significance, Nov 20, 2026).
A cross-check I ran with the standard two-proportion formula gave 21,108, 80,681, 42,693 and 8,158 for the same four cases (My own formula check, Nov 20, 2026), so the figures are in the same ballpark. The pattern is simple: a lower baseline or a smaller lift needs far more traffic.
I then ran the same lift through VWO's A/B test significance calculator (now under the Wingify name) on its default settings. With 100 conversions out of 5,000 visitors against 120 out of 5,000 (2.00% versus 2.40%, a 20% lift), "Probability of Better" came to 75.01% and the verdict was "No significant winner" (VWO calculator run, Nov 20, 2026). With 400 out of 20,000 against 480 out of 20,000 (the same 2.00% versus 2.40%), it showed 99.52% and the verdict was "Variation is better than baseline" (VWO calculator run, Nov 20, 2026).
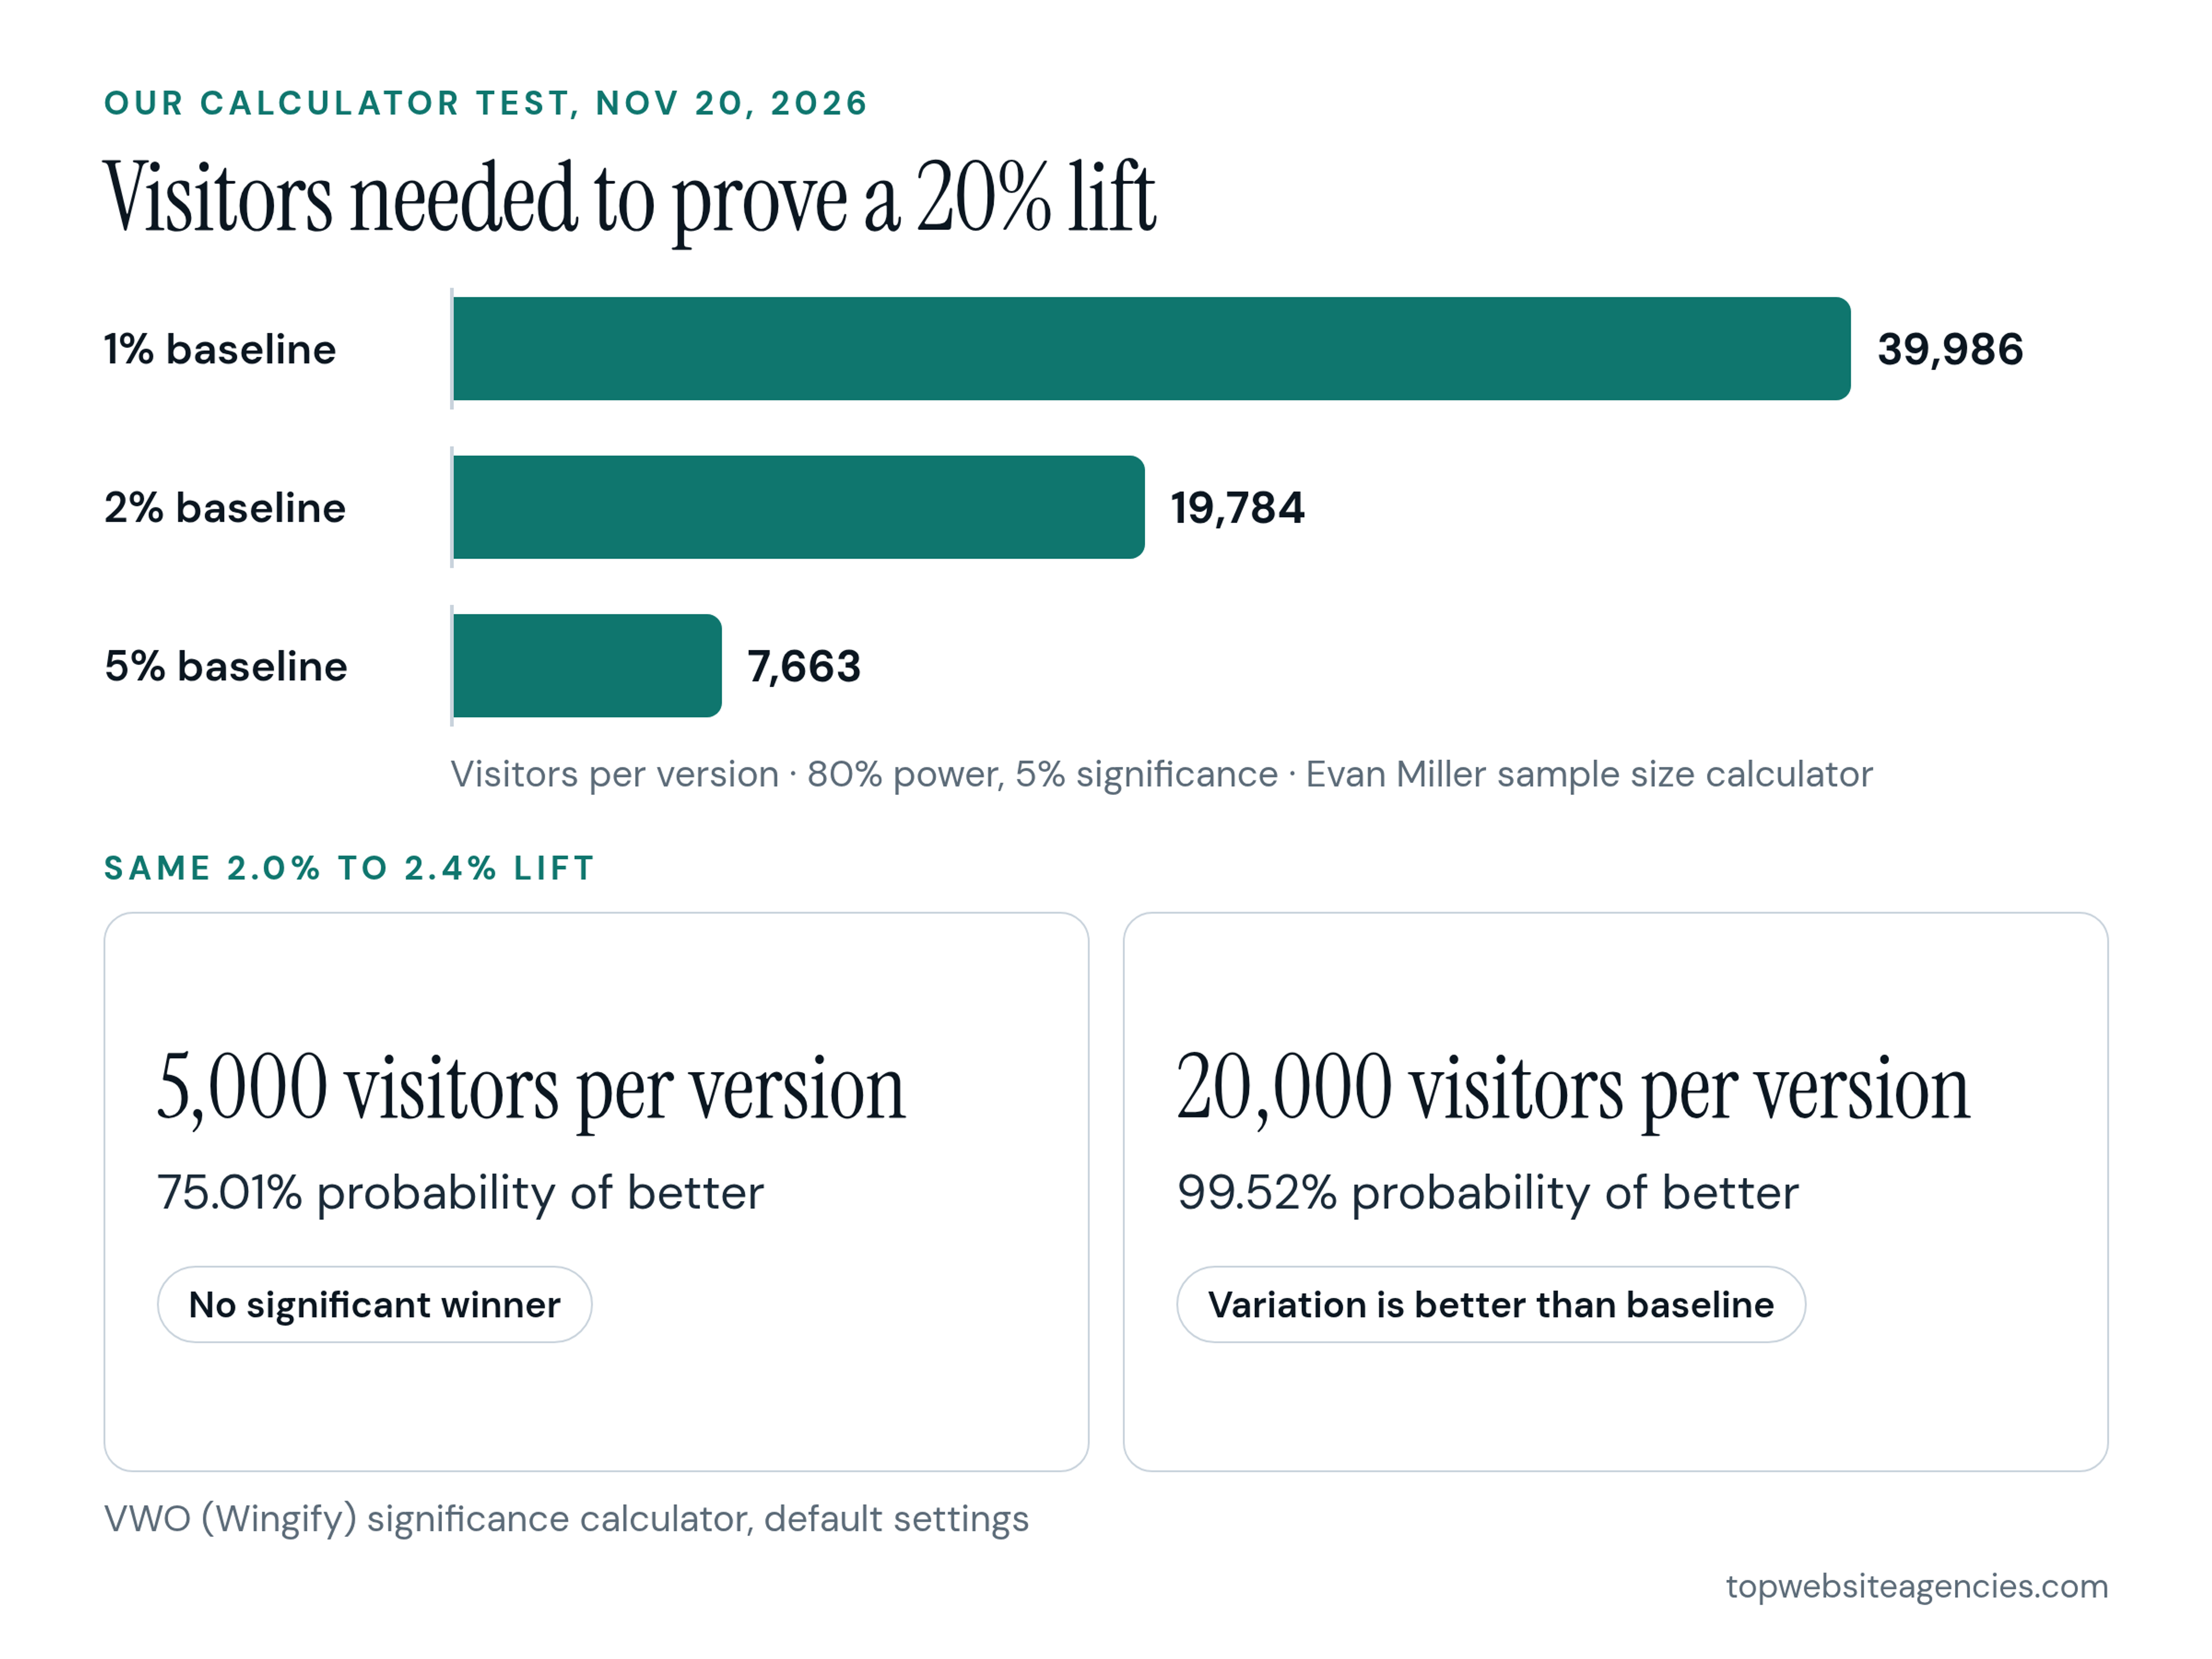
On a 2% baseline, the same 20% headline lift is inconclusive at 5,000 visitors per version and statistically convincing at 20,000 (VWO calculator runs, Nov 20, 2026). These are two free calculators with simple inputs, not an audit of any agency. They do show why a lift claim without a traffic figure and a test length is incomplete. If your monthly traffic is low, work out how long that many visitors would take before you agree to a testing plan.
Questions I would ask an agency before signing:
- What is our exact baseline, and how is a conversion defined?
- Which time period are we using to measure?
- How much traffic does a test need, and how long will it run?
- Are we prioritizing total revenue or just the percentage rate?
- How will we balance rate against revenue? Nielsen Norman Group's 2013 advice is to optimize the conversion rate, not maximize it.
- Which factors outside design (price, brand, traffic mix) are assumed fixed?
Next step: send your baseline and monthly traffic to each shortlisted agency and ask them to estimate test length from it.
Frequently Asked Questions
What is a good conversion rate on a website?
Nielsen Norman Group's 2013 article says a good rate is usually in the 1%-10% range, depending on what you're counting, and that the more useful test is whether it is higher than what you had before. For context, Statista reported 1.6 percent for visits to e-commerce websites worldwide in the third quarter of 2026, and Unbounce's 2024 report gives a median of 6.6% for the landing pages Unbounce analyzed.
Is 12% conversion rate on a website good?
It depends on what is being counted. Unbounce's 2024 report shows a median of 6.6% and nine industry figures from 3.8% to 12.3% for the landing pages Unbounce analyzed, so 12% would sit near the top of that range. Against Statista's 1.6% for visits to e-commerce websites worldwide in the third quarter of 2026 it would be far higher, but those two sources do not measure the same thing. First check whether your 12% is a primary conversion or a micro conversion.
What is the average conversion rate for a website?
There is no single average. Statista reported 1.6 percent for visits to e-commerce websites worldwide in the third quarter of 2026. Ruler Analytics' November 2026 benchmarks, based on 5 million+ conversions (forms and calls) across 13 industries, put the average at 5.13%. Unbounce's 2024 report gives a median of 6.6% for the landing pages Unbounce analyzed.
Is a 1% conversion rate good?
Possibly. According to Nielsen Norman Group (2013), a good rate is usually 1% to 10% depending on what you count, so 1% sits at the low end, and it is below the 1.6% that Statista reported for visits to e-commerce websites worldwide in the third quarter of 2026. The better test is whether it is higher than your own previous period. Proving a lift on a 1% baseline is also slow: a 20% relative lift needed 39,986 visitors per variation at 80% power and 5% significance (Evan Miller sample size calculator, Nov 20, 2026).
Conclusion
A website conversion rate is only as useful as its definition: the conversion you count, sessions or users, and the period you measure. The headline benchmarks I compared run from 1.6% for e-commerce visits (Statista, Q3 2026) to a 6.6% landing-page median (Unbounce, 2024) because they count different things, so your own baseline is the most reliable comparison. Before you sign with anyone, ask what lift they expect and how much traffic it takes to prove it.
Next step: take your baseline and the questions above to the agencies in the rankings on this site.